

The big money is made in the waiting
The most common question investors are asking me today is, “Is now the time to go to cash?”
Volatility, uncertainty, complexity, ambiguity. This is the reality equity investors face. Add in the risks of trade wars, geopolitical tensions, climate change, sky high valuations in parts of the market and the threat of a pandemic and you can understand why some investors are questioning whether the risks are skewed to the downside.
Looking forward to 2020 and beyond, how do you position for such a challenging investment environment? This article provides some key learnings from over 30-years investing in equity markets. It addresses the perils of market timing, key considerations for investors and how to maximise your long-term returns. In the end, time in the market is what counts. Legendary investor Charlie Munger from Berkshire Hathaway sums it up best,
“the big money isn’t in the buying and selling… It’s in the waiting.”
30-years in Australian equities
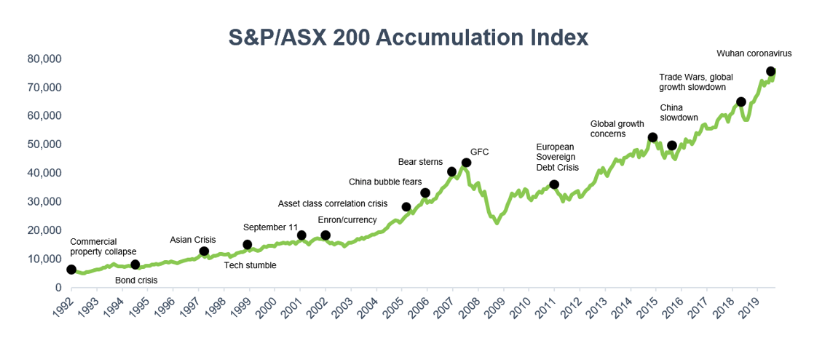
Over the past three decades, investors in the Australian equity market have been through some challenging market conditions. The chart below highlights some of the most difficult periods for me as an investor. The Asian Crisis, September 11, the GFC, fears of global growth slowing (x2) and now Wuhan coronavirus. When you are in the moment, the risks you are facing seem insurmountable. But the chart also provides what is increasingly becoming a unique perspective – a long-term view.
 Source: Facset
When you put the fears and uncertainties of the past into perspective over a longer time horizon, they are generally overstated. The market recovers. And patient, long-term investors have been rewarded. The Australian equity market has delivered over 9% per annum since 1992, for those that have stayed invested.
The perils of timing the market
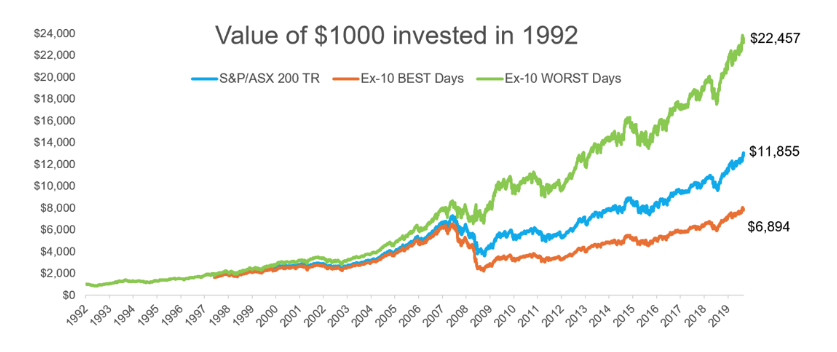
Compounding at over 9% per annum since 1992 results in some seriously impressive returns. As the chart below highlights, if you invested $1,000 in 1992 and stayed invested in the Index, that initial investment would be worth $11,855 today. But what if you could time the market and avoid the 10 worst performing days in the market over the past 30 years?
The results are impressive. Avoiding the 10 worst performing days (green) in the market almost doubles your return on an initial $1,000 investment to $22,457. So, market timing works, right? Well, unfortunately it gets a lot more complex when you analyse the data. Because not only do you have to avoid the worst days. You must also stay invested during the best performing days. As the chart below shows, missing the 10 best performing days (orange) resulted in a loss of almost half of your potential gains vs simply staying invested in the Index. Market timing can be very lucrative… but also very costly to long-term returns.
 Source: Firetrail Research, Factset
To make matters even more challenging, the biggest daily gains in the equity market are closely followed (or preceded) by the biggest daily losses. Large gains and losses tend to cluster. With the largest gains/losses in the past three decades clustering around the Asian Crisis/tech stumble, the GFC, The EU Sovereign Debt Crisis and during concerns around slowing China/Global growth. The increased volatility during these periods increases risk to the upside and the downside.
Getting it wrong by a month
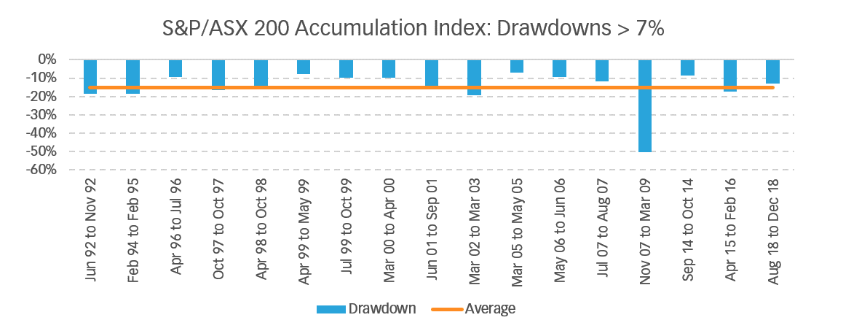
One month can make all the difference. The chart below highlights all the major market downturns during the past 25-years, including the event and the duration. There were 17 negative returns of over 7%, with an average drawdown of 15%.
 Source: Firetrail Research, Factset
What is clear from the data is that if you could time the market, avoiding the 17 largest equities market drawdowns over the past 25 years would have added significant value to your investments. However, could you have predicted the catalysts and the timing to perfection? The statistical chance of getting every market timing call right to the day is about one billion to one.
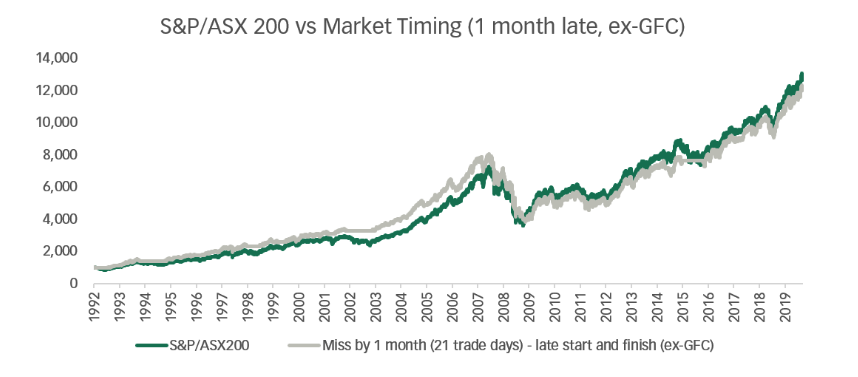
The odds are not in your favour. Even IF you managed to pick every one of the downturns (Ex-the GFC), your timing needs to be perfect. Being wrong by just one month (eg. one month late) would have resulted in you underperforming the Index over the long-term.
 Source: Firetrail Research, Factset
Now the exception to the rule was the GFC, which peak to trough fell over 50%. If you picked the GFC, you would have outperformed. But consider this. The market has just fallen 50%. All your friends, family, and clients have been impacted. You’ve made the call to move into cash, just in time to witness one of the worst crashes in history… Are you now brave enough to go ‘all in’ with your equity exposure on April 2009?
Between April 2009 and December 2009, the Australian equity market rallied over 60%. The biggest upswing the market has seen in the last 30-years was straight after the worst downturn. And it happened within 8 months. Part of the challenge is getting back into the market quickly enough, often very quickly after your decision to sell into cash (not to mention the trading costs associated with this strategy). How do you know the right time to make the move? This makes market timing very difficult, if not practically impossible.
‘Trumped’ timing: A case study in market timing
In August 2016, I reached out to 30 different professional investors, CEO’s and market experts to ask them two simple questions:
- Can Donald Trump win the US election?
- If he does win, what will the subsequent direction of the share market be?
80% of respondents told me that Hilary Clinton would win the 2016 election. It seems obvious with hindsight that wasn’t going to be the case. But at the time, this view was consistent with polling and betting markets which gave Clinton a 5 to 1 probability of becoming the next US President.
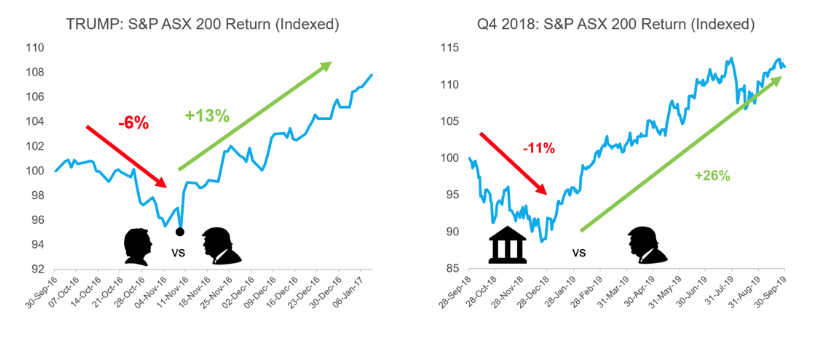
The answer to the second question was even further from the truth. 95% of respondents said that if Trump did win, equity markets would fall by 10% (on average). As the probability of Trump winning increased in the lead up to the election, equity markets started to fall. The first chart below highlights what happened when Trump was announced as US president in November 2016. Some of the most successful CEO’s and investors in the country got not only the result wrong, but the direction of the share market wrong too.
More recently in Q4 2018, inflation had reared its head and the risks of global trade wars escalated further. The market reacted swiftly, selling off global and Australian shares which fell over 10% during the quarter. However, on the back of no new news, the market direction changed on 23 December 2018. Urged on by a pivot in the US Fed policy toward an easing bias, the market subsequently increased by over 26% in the next 9 months – and has continued to rise to new heights today. As the second chart below shows, investors who moved into cash, had to move back into equities swiftly in order to capture the subsequent gains.
 Source: Facset
The lesson for investors, is that market timing is a high risk, low return strategy. Making the decision to move from equities into cash is one of the most difficult decisions an investor can make. As legendary investor Peter Lynch warns,
“Far more money has been lost by investors trying to anticipate corrections… than has been lost in corrections themselves.”
Are you an investor or a trader?
One key question you can ask yourself during times of increased volatility, uncertainty, complexity and ambiguity is am I an investor or a trader? There are some key distinctions:
- An equity investor: Looks to generate returns over the medium to long-term (5-7+ years). They are cognisant of short-term risks, but position for the long-term opportunity. Fundamental valuations, a longer time horizon and rational decision making are part of an investor’s toolkit;
- An equity trader: Makes trading decisions based on short-term news. Often overreacts to headlines. Incorrectly extrapolating information into the future. High trading, high frequency decisions and the latest headlines are part of the trader’s toolkit.
Whether you view yourself as an investor or a trader can have a material impact on your decision-making. In my view, investors have a distinct advantage in equity markets given their longer time horizon. Volatility, fear and uncertainty can create opportunities to buy companies at a material discount to their intrinsic value. Taking this approach in the short-term may be uncomfortable. But over the long-term, some of the best investment decisions I’ve made started as uncomfortable opportunities.
How to maximise your long-term returns
Who are Australia’s best investors? Well, the typical Aussie homeowner must be in the top decile.
Why are they such effective investors? Time and patience. The average holding period for an Aussie homeowner is over 7 years (approximately 7-8 years for units and 9-10 years for homes).
Taking a longer-term view of 7-years or more can significantly increase your chance of investing success. For instance:
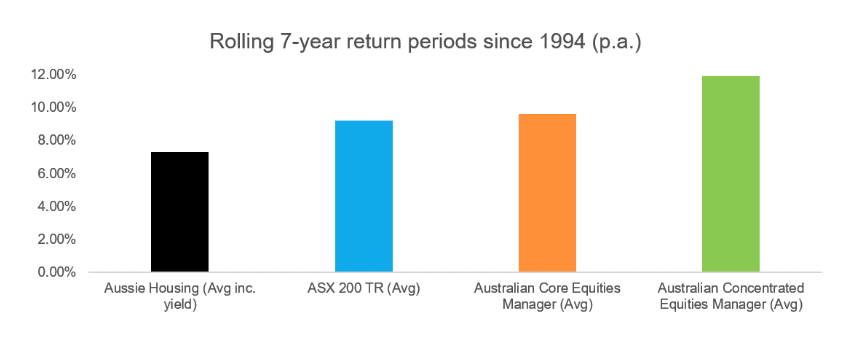
- Since 1994, the average Australian home price has increased by over 7% per annum. And over any rolling 7-year period, house prices have always appreciated.
- Over the same rolling period, the Australian equity market has never delivered a negative return. Including during the GFC! On average the Index has delivered over 9% per annum, in any rolling 7-year period.
- And as the chart below highlights, active management has also delivered when you take a longer-term view. Particularly managers that take a concentrated approach have delivered more than 2% per annum above the Index on average, over any rolling 7-year period (after all fees).
 Source: Firetrail Research, Morningstar Australian Equities Universe Data, Corelogic, ABS, Factset
The implications are material when it comes to making investment decisions. Taking a 7-year view can significantly improve your chances of investment success. Whilst today the debate regarding active vs passive management has hit fever pitch levels, over the long-term active managers have delivered. And when comparing active managers across the universe, a highly active, concentrated approach works best.
Conclusion: Is now the time to go to cash?
Volatility, uncertainty, complexity and ambiguity. These are the conditions investors face today. While we can speculate on where equity markets will go in 2020 and beyond, the simple truth is we don’t know the answer. Risks are elevated. But when I look across the equity market, so are the opportunities.
Positioning for this kind of environment is challenging. One of the best questions you can ask yourself is “are you a trader or an investor?” For investors, the key is to make sensible, long-term capital allocation decisions, and to stay patient. The big money isn’t made in the buying and selling. It isn’t made trading in and out of the equity market. The big money is made in the waiting. For patient, long-term investors, there are always opportunities to add value. But timing the market isn’t one of them.
Article by Patrick Hodgens, Portfolio Manager – Firetrail Investments